
sudo pip install gdashIntroducing gdash - GlusterFS Dashboard
Dec 4, 2014
2 minutes read.
glusterfs
tools
glusterfsblog
UPDATE: Added --gluster option to specify the path to gluster. By default it looks for /usr/sbin/gluster, If you installed GlusterFS using source install then use sudo gdash --gluster /usr/local/sbin/gluster. (Those who already installed gdash, can run sudo pip install -U gdash to upgrade.)
gdash is a super-young project, which shows GlusterFS volume information about local, remote clusters. This app is based on GlusterFS’s capability of executing gluster volume info and gluster volume status commands for a remote server using --remote-host option.
If you can run gluster volume info --remote-host=<HOST_NAME>, then you can monitor that cluster using gdash. Make sure you allow to access glusterd port(24007) for the machine where you will run gdash.
To install,
or
sudo easy_install gdash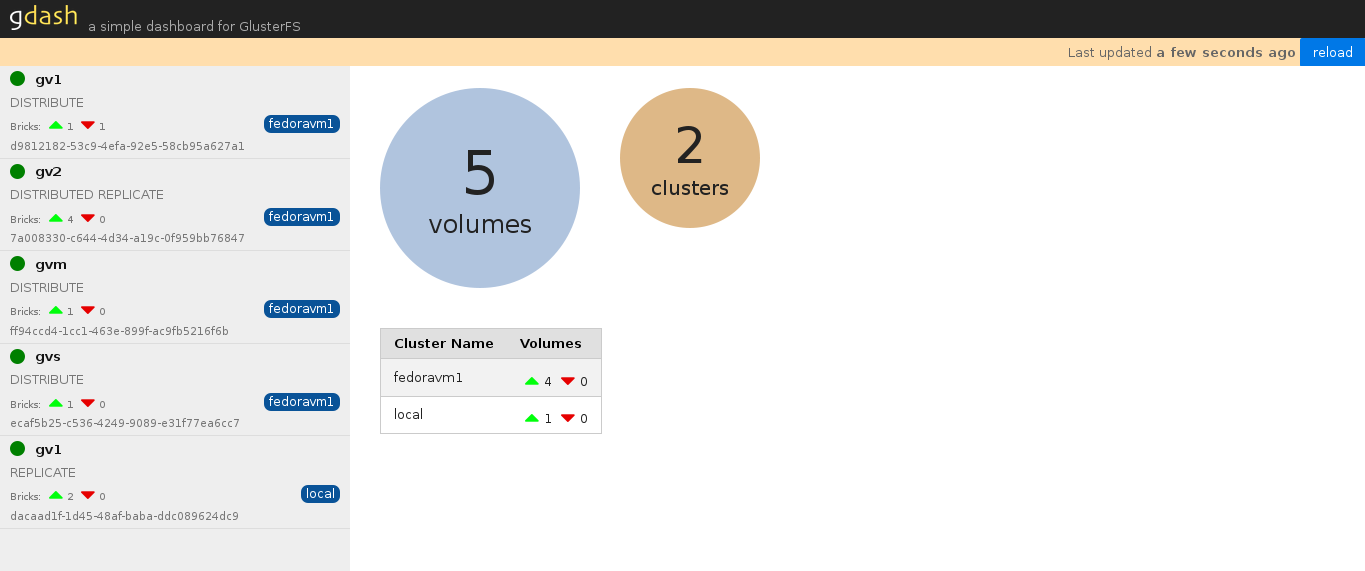
gdash home screen
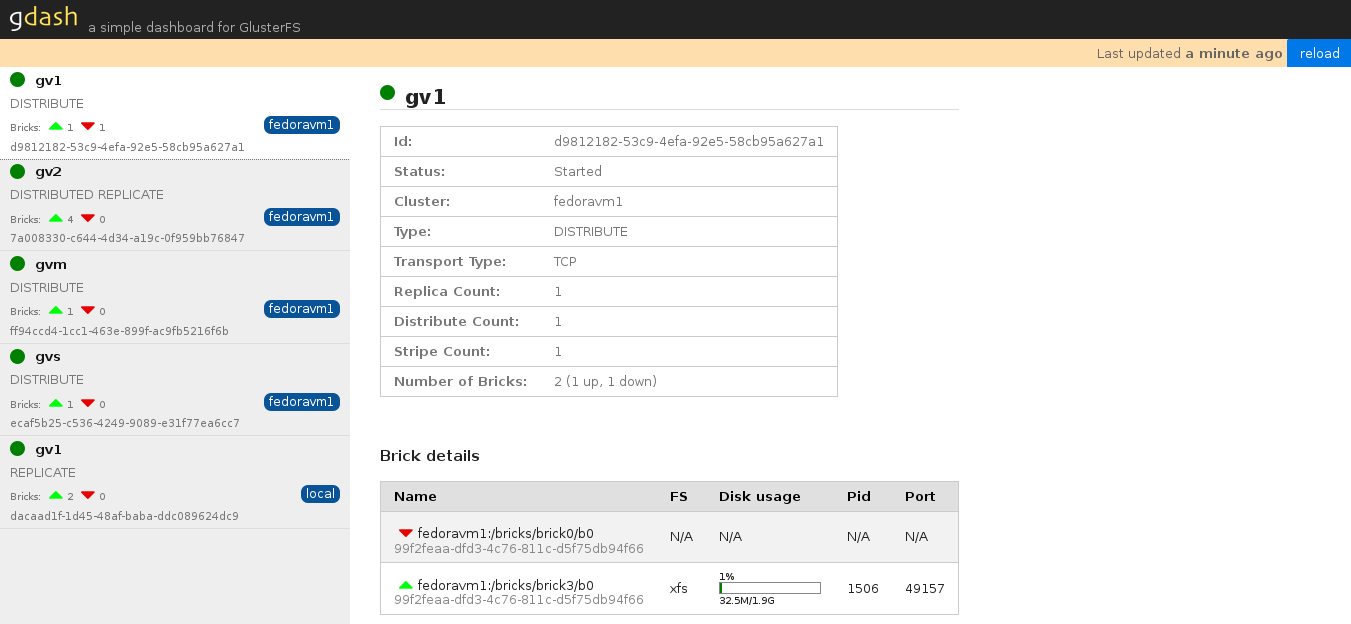
gdash Volume details page
Usage
Use case 1 - Local Volumes
Just run sudo gdash, gdash starts running in port 8080. visit http://localhost:8080 to view GlusterFS volumes of local machine.
Use case 2 - Remote Volumes
Run sudo gdash --host 192.168.1.6, visit http://localhost:8080 to view GlusterFS volume information of remote host. Dashboard shows all the volumes which are part of that remote host.
Use case 3 - Multiple clusters
Create a clusters.conf file as example shown below, specify at least one host from each cluster.
[clusters]
cluster1 = host1, host2, host3
cluster2 = host4, host5, host6
Run gdash using,
sudo gdash --clusters ~/clusters.confUse case 4 - Multiple teams
If two teams monitoring two clusters and if you don’t want to share the other cluster details then, just run below commands in two terminals and give respective URL to each team. Other solution is create two seperate config files and run it separately for different ports.
# Team 1, who monitors cluster1 http://localhost:8001
sudo gdash -p 8001 --clusters ~/clusters.conf --limit-cluster cluster1

# Team 2, who monitors cluster2 http://localhost:8002
sudo gdash -p 8002 --clusters ~/clusters.conf --limit-cluster cluster2
Available Options
usage: gdash [-h] [--port PORT] [--cache CACHE] [--debug] [--host HOST]
             [--clusters CLUSTERS] [--limit-cluster LIMIT_CLUSTER]

GlusterFS dashboard
-------------------

This tool is based on remote execution support provided by
GlusterFS cli for `volume info` and `volume status` commands

optional arguments:
  -h, --help            show this help message and exit
  --port PORT, -p PORT  Port
  --cache CACHE, -c CACHE
                        Cache output in seconds
  --debug               DEBUG
  --host HOST           Remote host which is part of cluster
  --clusters CLUSTERS   Clusters CONF file
  --limit-cluster LIMIT_CLUSTER
                        Limit dashboard only for specified cluster
Code is hosted in github/aravindavk, licensed under MIT.
About Aravinda VK
Partner at Kadalu Investments, Creator of Sanka, Creator of Chitra, GlusterFS core team member, Maintainer of Kadalu Storage