
    Year,Blog
    2008,12
    2009,20
    2010,11
    2011,19
    2012,16
    2013, 6
    2014, 7
    2015, 9
    2016,12
    2017, 3
    2018, 2
2019, 1Area Charts using R base Graphics
Feb 17, 2019
1 minute read.
R
area-graph
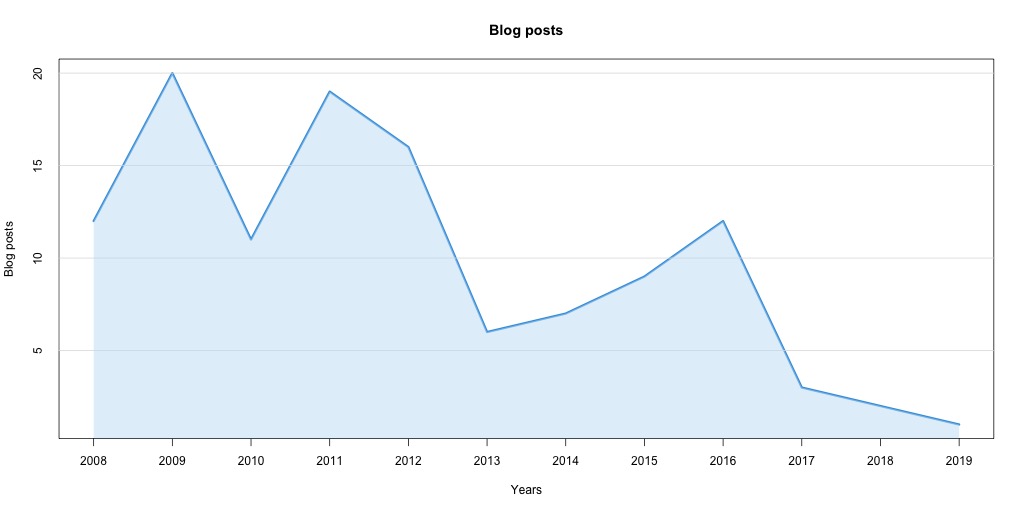
Today I learnt to create Area chart using R Base
graphics. polygon function (help(polygon)) can be used to fill
the area under the line.
Lets pick a simple data set from my website - Number of blog posts per year.
Now lets draw the line graph as below.
    dat <- read.csv("blogs_data.csv")
    numYears <- length(dat$Blog)

    plot(
        c(1:numYears),     # x axis
        dat$Blog,          # y axis
        type="l",          # Line graph
        col="#409ddf",     # Line Color
        lwd=3,             # Line Width
        xlab="Years",      # X axis label
        ylab="Blog posts", # Y axis label
        xaxt="n",          # Show X axis
        yaxt="n",          # Show Y axis
        main="Blog posts", # Graph main title
        )

    axis(1, at=1:numYears, labels=sprintf("%s", dat$Year))
    axis(2, tck=1, col="#dddddd")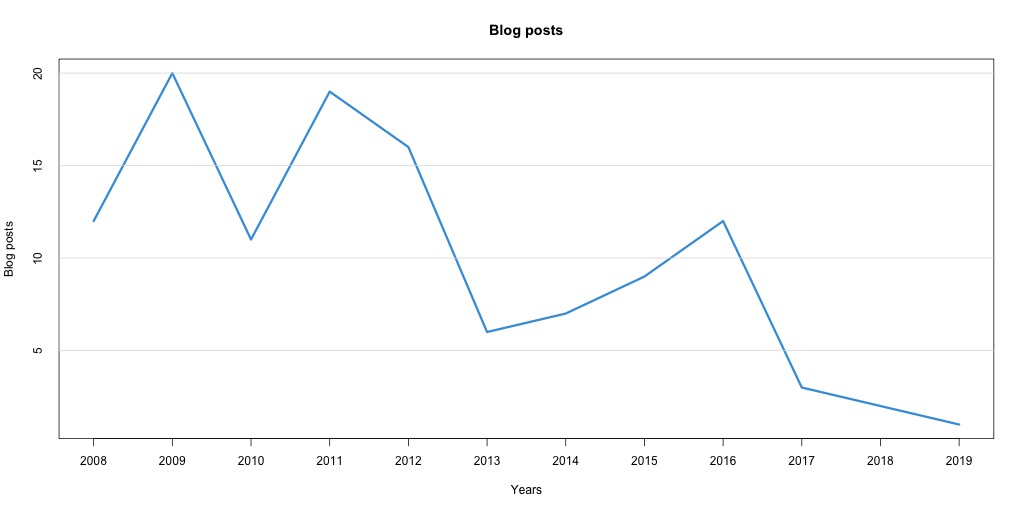
Identify the points required to draw a polygon as below,
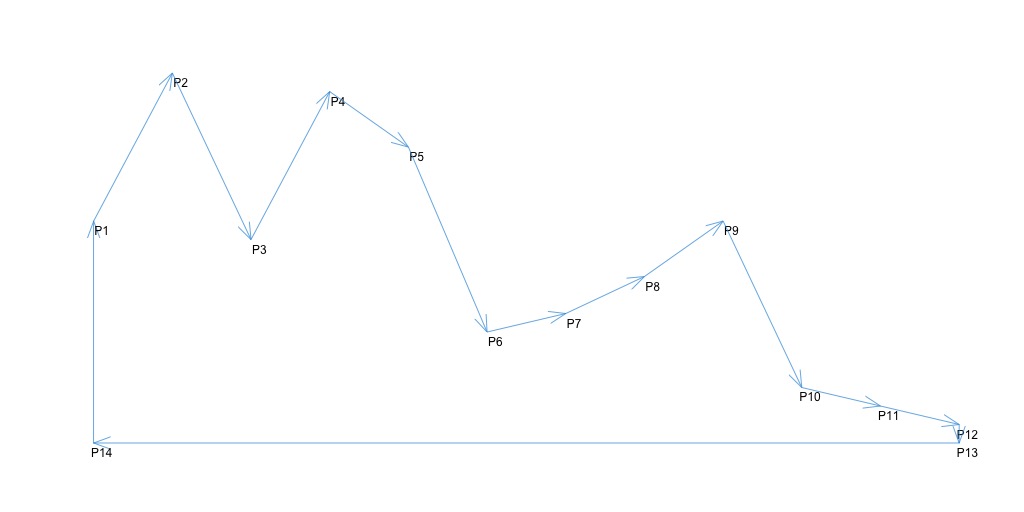
yy <- c(0, dat$Blog, 0, 0)          # P14, P1:P12, P13, P14
xx <- c(1, 1:numYears, numYears, 1) # P14, P1:P12, P13, P14
And draw polygon using,
polygon(xx, yy, col="#c3e1f57d", border=NA)And the final Area chart,
Comments and suggestions welcome.
About Aravinda VK
Partner at Kadalu Investments, Creator of Sanka, Creator of Chitra, GlusterFS core team member, Maintainer of Kadalu Storage